KPIs provide specific and measurable insights into the performance of your contact center. Learn which essential contact center KPIs to track to boost productivity and enhance the customer experience.
Managing a contact center can be difficult. Between managing queues, de-escalating customer situations, and supervising agents, it can be almost impossible to find the time to drive improvements and efficiencies in your contact center.
Some of the most successful contact centers have figured out how to sift through large amounts of data to identify what is most important. One way to easily increase efficiencies is to understand the contact center KPIs and metrics that are essential to agent productivity and the customer experience.
What is a KPI?
A key performance indicator (KPI) is a metric or score that indicates progress towards a specific goal. Business leaders use KPIs to understand how effectively a company or business unit is achieving short-term or long-term goals.
Contact centers use KPIs to measure agent productivity, customer service, and operational efficiency, among other things. Common KPIs measured in contact centers include abandon rate, average handle time, and first contact resolution.
Why is it Important to Monitor Essential Contact Center KPIs?
Monitoring essential contact center KPIs is crucial for maintaining efficiency, optimizing performance, and delivering an exceptional customer experience. These key metrics provide visibility into how well your agents, technology, and processes work together, allowing you to identify bottlenecks, track customer satisfaction, and make data-driven improvements.
By regularly analyzing KPIs like first call resolution, average handle time, and service level, contact center leaders can pinpoint areas for coaching, streamline operations, and reduce costs—all while ensuring customers receive faster, more personalized support. In short, consistent KPI tracking turns data into actionable insights that drive long-term success.
In this article, we will review the 15 most important KPIs to track within any contact center.
8 Essential Real-time Contact Center KPIs
The first set of metrics we are going to examine is measured in real time and accessed immediately. These KPIs change as agents assist customers and people contact your organization through chat, email, or phone.
Real-time KPIs are essential for ensuring your contact center operates efficiently and effectively.
Below are 8 real-time KPIs that you should regularly track to maintain a high-performing contact center.
1. First Contact Resolution (FCR)
First contact resolution is an essential contact center KPI that measures how often customer issues are resolved within the first interaction with an agent. A high FCR shows that agents are working effectively at addressing customer queries and reducing the need for follow-up calls. As you might imagine, there is a direct link between high FCR rates and customer satisfaction levels.
How to Calculate First Contact Resolution (FCR):
Tips for Accurate Measurement
Decide whether to include or exclude repeat contacts within a specific time frame (e.g., exclude repeat customers within 7 days or 30 days).
Track FCR separately for each channel (phone, email, chat) for more insights.
Use CRM or call center software to automate tracking and reduce manual errors.
2. Average Time in Queue (ATQ)
Everyone knows the feeling of waiting on hold for what feels like forever. Long wait times in queue can lead to frustrated customers, negative reviews, and an overall poor customer experience.
For this KPI, shorter average times are better. If your average time in queue is high, it usually indicates inefficiencies in the contact center or the need to hire additional agents.
Potential solutions may include additional resources for agents, training to handle calls more efficiently, or adding a callback service to effectively reach customers on their time.
How to Calculate Average Time in Queue:
Tips
Exclude calls that are abandoned before reaching an agent if you want a more accurate measure of answered calls.
Track ATQ by time of day, queue, or agent group to identify peak-time bottlenecks.
Use your contact center software or reporting tool for automated calculation.
3. Abandonment Rate
The abandonment rate or sometimes called abandon rate measures the percentage of customers who exit the system before they reach an agent. A high abandon rate can indicate the wait time to reach an agent is too long, creating an unpleasant customer experience.
High wait times suggest that there are not enough agents to meet the demand or that they need additional training to handle customers’ inquiries more efficiently. All in all, the abandon rate is valuable to monitor to ensure a positive customer experience and agent productivity.
How to Calculate Abandonment Rate:
Tips
Some organizations calculate this statistic based only on calls abandoned after a certain wait time (e.g., after 30 seconds) because calls abandoned earlier are considered ‘short abandons’ (see below).
Track abandonment rate by queue, time of day, or agent group to pinpoint issues.
Use contact center reporting software to automate calculation and get real-time monitoring.
4. Short Abandon Rate
Another KPI that will help you understand the call abandonment is the short abandon rate, which is the percentage of customers who exit the system within a short time frame (e.g.., 10 seconds).
Typically, the short abandon rate captures customers who exit the system due to a misdial rather than an unnecessarily long queue time or poor customer service. Setting a proper short abandon rate will ensure your abandon rate isn't skewed by misdials, since it is subtracted from the overall KPI.
How to Calculate Short Abandon Rate
Tips
Set a clear threshold time for what counts as “short” (commonly 5–30 seconds).
Exclude short abandons from your main abandon rate to get a more realistic view of true customer dissatisfaction.
Use contact center reporting tools to automate this metric.
5. Average Time to Abandon (ATA)
Similar to the abandon rate, the average time to abandon measures the average amount of time each abandoned contact waited in the queue. A low average time to abandon can indicate customers are unwilling to wait, and you may need more agents to support the queue to improve the customer experience.
This KPI is critical to consider when setting targets for average queue time and short abandon rate. Understanding the average time to abandon can directly improve the customer experience and inform agent resourcing decisions.
How to Calculate Average Time to Abandon
Tips
Track ATA alongside Abandon Rate and Short Abandon Rate for a more complete view of queue performance.
Segment by queue or time of day to identify peak-time issues.
Use your contact center software to automate calculation.
6. Grade of Service (GOS)
Monitoring the grade of service (GOS) in real time can help ensure a high level of agent productivity. GOS measures the percentage of customers that have been handled within the target speed of answer.
The GOS is usually given as two numbers. For example, a GOS of 80/30 would indicate 80% of calls answered within 30 seconds. First you have to set the target speed of answer and then you can calculate the percentage of call answered within that target. The GOS is one of the best indicators of agent productivity.
When this KPI is too low, it may indicate agents aren't moving from one customer to the next as quickly as they could. There are several possible solutions to a low GOS, including providing agents with additional resources and training.
How to Calculate Grade of Service
Tips
Track GOS by queue or time of day to identify peak-period staffing issues.
Combine GOS with Average Speed of Answer (ASA) and Abandon Rate for a full view of call responsiveness.
Use contact center reporting tools to automate real-time monitoring.
7. Occupancy Rate
The occupancy rate measures the percentage of total work time that agents spend on customer interactions or in wrap-up time. This KPI is essential for monitoring agent productivity.
If this KPI is too low, it can indicate that agents are spending too much time not engaging in work-related tasks, or that there are too many agents on duty at once.
However, it’s important to not be too aggressive when setting the target occupancy rate. There needs to be a good balance between work and rest, as too high of an occupancy rate can lead to agent stress and burnout.
How to Calculate Occupancy Rate
Tips
Ideal occupancy rates typically range between 75–85%; too high of an occupancy rate can indicate agent burnout, and too low can indicate underutilization.
Include after-call work (ACW) for a more accurate measure of productive time.
Track by individual agent, team, or shift to optimize staffing and scheduling.
8. Average Wrap-Up Time (AWT)
This KPI measures the average time it takes for agents to complete customer-related tasks after the conversation has finished. Agents enter the wrap-up state after assisting a customer. This allows them to finish any necessary tasks to complete the customer request and prevents them from receiving another customer from the queue until they are finished any post-call work.
While it's beneficial to minimize wrap-up time to ensure agents are ready to help the next customer, you also want to ensure they are completing the work accurately and thoroughly. In order to minimize wrap-up time, it can be helpful to provide agents with structured templates, tools, or use AI such as agent assist, call summarization, and contact insights to make customer support easier for your agents.
How to Calculate Average Wrap-Up Time
Tips
Track AWT separately for different call types to identify where extra after-call time occurs.
Combine with Average Handle Time (AHT) to see total agent workload per interaction.
Use your contact center software to automatically calculate and report AWT.
7 Essential Historical Contact Center KPIs
Although real-time KPIs help your organization make decisions based on current challenges and opportunities, historical KPIs offer insights on long-term trends and customer data. Historical KPIs are particularly helpful in identifying areas of growth for agent productivity, resulting in an overall more efficient and streamlined contact center.
Here are the top 7 historical KPIs that you should track in your contact center.
9. Average Handle Time (AHT)
This KPI measures the average time from when an agent answers a customer call to when they release it. This average doesn't include the time when a customer is on hold or when consultation or conference calls are placed.
The key to tracking the average handle time is to find a benchmark that accounts for the appropriate workload and allows agents to provide a positive customer experience in a reasonable amount of time.
If the average is too high, it may indicate agents are struggling with customer requests. On the other hand, if the average is too low, it may indicate customers aren't getting the proper support they need.
Other tools, such as quality assurance, can be used in combination with the average handle time to ensure a positive experience. Proper tools and training can help agents respond to customer queries in a timely and effective manner.
How to Calculate Average Handle Time (AHT)
Tips
Track AHT by agent, queue, or call type for deeper insights.
Combine with First Call Resolution (FCR) and Customer Satisfaction (CSAT) to evaluate both efficiency and quality.
Use automated reporting tools to calculate AHT in real time.
10. Customer Satisfaction and Net Promoter Score
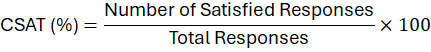
While customer satisfaction can be difficult to measure, it is the most direct way of telling if your contact center is successful at providing a positive customer experience. Customer satisfaction scores (CSAT) can be calculated using surveys where customers can rate their experience, level of support, and whether their questions were answered.
Through surveys, you can also measure the net promoter score (NPS) to monitor the level of customer service provided over time. The net promoter score measures how likely a customer is to recommend your organization's product or service to a friend or colleague. It is regarded as one of the best measures of customer satisfaction.
How to Calculate Customer Satisfaction (CSAT)
How to Calculate Net Promoter Score (NPS)
Tips
CSAT is transaction-specific and best for measuring immediate satisfaction.
NPS gauges long-term loyalty and overall brand perception.
Both metrics are often tracked together to get a complete view of customer experience.
11. Customer Effort Score (CES)
Similar to customer satisfaction scores, customer effort scores can be measured through surveys sent out following an interaction. Customer effort scores are used to measure how much effort the customer had to put in to resolve their issue. You can add a question in your customer survey that asks how easy it was to contact your business or to rank the level of effort required out of 5 or 10.
How to Calculate Customer Effort Score (CES)
Tips
Use a consistent scale across surveys for accurate comparisons over time.
Segment CES by channel, issue type, or agent team to find friction points.
Combine CES with CSAT and NPS for a full picture of customer experience.
12. Agent Absenteeism
Agent absenteeism is the total number of days per year that agents are absent as a percentage of the total number of working days. Agents can be absent for many reasons, including sick days, burnout, mental health, and high levels of stress.
A high agent absenteeism rate may indicate high levels of agent stress. While there can be many reasons for this, one reason could be unreasonable targets or a need to hire additional agents to manage the workload.
Agent absenteeism can affect the workload distribution and decrease agent morale. Monitoring this KPI can be helpful for budget planning and optimizing workforce management practices.
How to Calculate Agent Absenteeism
Tips
Track absenteeism by team, shift, or agent to identify trends or problem areas.
Include both planned (vacation, personal leave) and unplanned (sick leave, no-shows) absences for a complete picture.
High absenteeism can lead to longer wait times, higher abandon rates, and lower service levels, so monitoring it is critical for operational efficiency.
13. Agent Turnover Rate
No business wants to train employees only to have them leave soon after. To prevent this, it’s important to keep track of your agent turnover rate. The agent turnover rate, also known as agent attrition rate, measures the percentage of agents that leave your contact center within a specific time period.
High turnover rates can indicate a problem with employee retention and may lead to skyrocketing training and hiring costs. Surprisingly, the industry standard for agent turnover in call centers is 30 to 40%.
How to Calculate Agent Turnover Rate
Tips
Track turnover monthly, quarterly, or annually to monitor trends.
Segment by team, shift, or tenure to identify patterns.
Combine with employee satisfaction and absenteeism metrics to understand root causes and reduce attrition.
14. Schedule Adherence
Schedule adherence is necessary to ensure your contact center is operating and utilizing resources efficiently. This KPI is measured as the percentage of the working day where an agent is available for interactions.
It's crucial to understand that agents can't be 100% productive all the time without suffering consequences such as burnout and low morale. However, a low schedule adherence rate may indicate that agents struggle with time management or are engaging in unrelated work tasks.
This KPI can be improved through adequate training, establishing team leads, or setting a reward system. Setting a proper schedule adherence benchmark can increase productivity, enhance operating efficiency, and improve internal planning.
How to Calculate Schedule Adherence
Tips
Track adherence per agent, team, and shift to identify patterns and optimize staffing.
Include login/logout times, breaks, and after-call work in your calculation for accuracy.
Low adherence often leads to longer queues, higher abandon rates, and lower customer satisfaction, making monitoring critical.
15. Revenue Per Call
One metric that is useful for tracking revenue generated by your contact center is revenue per call. As businesses increasingly turn to their contact centers for revenue growth, it is important to evaluate the average amount of revenue generated from each call. You can look at revenue per call on an agent-by-agent basis or for your contact center as a whole.
How to Calculate Revenue Per Call
Tips
Track RPC by agent, campaign, or call type to identify high-performing areas.
Use RPC alongside conversion rate and average handle time for a full picture of call center performance.
Regularly monitor trends to optimize sales strategies or upsell opportunities.
Why Tracking Contact Center KPIs Is Key to Success
Monitoring essential contact center KPIs is necessary for planning and strategizing for the long-term success of your contact center. Tracking KPIs such as the average time in queue, abandon rate, and grade of service can significantly improve the level of customer service your contact center is providing.
Additionally, tracking KPIs such as average handle time, agent absenteeism, and schedule adherence can inform business decisions related to scheduling, capacity, and operating efficiency.
If you are interested in learning more about optimizing your contact center, check out our blog on Contact Center Data Silos.
Subscribe to our newsletter
Thank you for contacting ComputerTalk!
We will be in touch with you shortly. There is also a "chat" button in the bottom right corner of the website if you wish to speak to us immediately.
Oops! Something went wrong while submitting the form.
%20-%20Google%20Ads.png)