Contact Center Dashboards: The Ultimate Guide
by Anastasia Micic | Published On May 7, 2024 | Last Updated November 1, 2024

Here is your ultimate guide to the different types of dashboards available and how they fit with your contact center.
Dashboards are one of the most crucial resources your contact center has.
They give you the power to monitor critical metrics, key performance indicators (KPIs), and events throughout your contact center.
By offering insights into the right data, dashboards help organizations optimize productivity, enhance customer experiences, and even reduce operational costs.
An intuitive and well-designed set of dashboards for agents and supervisors, showing real-time metrics, and historical insights ensure you can take a data-driven approach to resource management and reaching your CX goals.
Read on to discover the power of contact center dashboards, with insights into dashboard examples.
What is a Contact Center Dashboard?
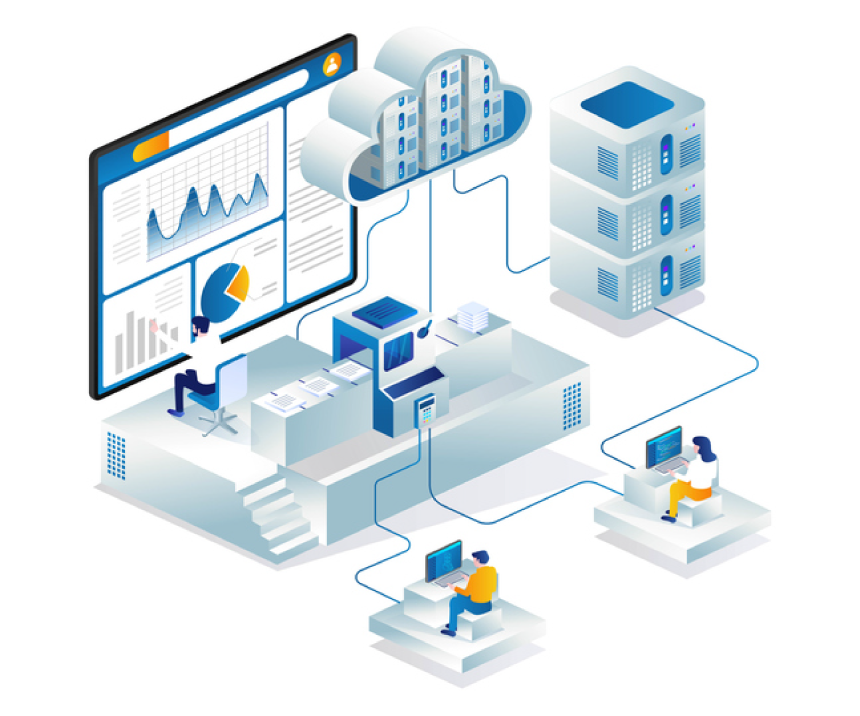
A contact center dashboard is a screen or interface that displays KPIs and metrics from your contact center. These dashboards convert relevant data about average handling times, wait times, customer satisfaction (CSAT) scores and more into visual representations, such as line graphs, bar charts, and heat maps.
In a fast-paced contact center, the right dashboard can align data from a range of channels, from voice calls to social media, and help ensure issues are spotted and resolved quickly, while keeping your team motivated.
Whether these dashboards are displayed on a physical screen in a traditional contact center, or via an app connected to your CCaaS platform, they pave the way for data-driven success.
The 5 Most Common Types of Contact Center Dashboards
In the contact center space, different dashboards are designed to address specific use cases and needs. The types of dashboards you leverage will vary depending on the goals you set for your business. Some of the most common types of dashboards include:
The Supervisor Dashboard
A contact center supervisor dashboard shares data about team performance, and crucial business metrics into a single interface for business leaders and managers. It can help supervisors to monitor key KPIs, such as customer satisfaction rates, average handling times, and first-call resolution rates, providing insight into the overall health and performance of the contact center.
At the same time, these dashboards assist supervisors in identifying their top-performing team members for rewards and recognition programs. Plus, they help to highlight potential weaknesses in teams, ensuring business leaders can determine which employees need additional training, and what kind of coaching initiatives may benefit them.
The Agent Dashboard
An agent dashboard in a contact center empowers individual employees to track their own performance and metrics; while also ensuring they can access crucial data relevant to the business. These dashboards can provide direct access to crucial tools, such as CRM integrations, AI assistants, and business documentation, to assist agents in managing conversations.
Some solutions can also integrate with unified communication and collaboration tools, ensuring agents can rapidly seek out support from subject matter experts. What’s more, with real-time monitoring and historic reporting features, agent dashboards help motivate and engage employees, allowing them to track performance improvements over time.
Live Data Dashboards
Live data dashboards provide an instant, real-time view of critical metrics affecting the contact center at any given moment. They allow companies to monitor and address issues and opportunities as they arise, tracking a customizable selection of KPIs or metrics.
Live data dashboards can deliver easy-to-read visual summaries of contact center activities to supervisors in seconds, sharing information about agent performance, queues, and interactions. They can also be configured with pop-up notifications and alerts, tuned to specific thresholds in your organization. With these tools, companies can mitigate issues faster, and rapidly access new opportunities.
Monthly KPI Dashboards
Monthly KPI dashboards allow companies to scan through data collected over a longer period of time to find patterns and opportunities aligned to contact center performance. The broader perspective offered by these dashboards means teams and team leaders can put key metrics into context and take intelligent steps to improve results in the long run.
Most monthly KPI dashboards focus on a select group of crucial metrics, such as first contact response time, customer satisfaction scores, number of incoming calls per day, and call resolution rates. However, customizable platforms allow companies to create monthly reports customized to any number of fields and metrics.
Key Metrics of Contact Center Dashboards
The metrics and KPIs tracked by contact center dashboards can vary depending on the nature of your business, and the type of dashboard you implement. The most valuable metrics for modern contact centers to monitor fall into three categories:
Real-Time Metrics
Real-time metrics are the crucial statistics companies need to monitor on a consistent basis to ensure they’re achieving their operational goals. Options include:
Call or contact volume: The number of interactions taking place at any given time.
Wait times: The length of time a customer spends on hold before speaking to an agent.
Agent availability: The number of available resources in your contact center team.
Performance Indicators
Performance indicators offer a comprehensive view into the overall performance of your team, and the success of your customer experience strategy. Some of the most valuable performance indicators monitored on contact center dashboards include:
First call resolution rate (FCR): The number of queries and calls that are resolved during the first interaction between your company and the customer.
Average Handling Time (AHT): The average amount of time it takes agents to resolve an issue.
Customer satisfaction (CSAT): The overall level of satisfaction experienced by customers who interact with your customer service team.
Agent-Specific Metrics
Common on both agent and supervisor dashboards, agent-specific metrics dive into the granular performance and behavior of each employee. They include metrics such as:
Individual performance: Overall scores for productivity, customer satisfaction rates, average handling times, and other factors.
Adherence: The level to which employees adhere to scripts, compliance requirements, and important operating procedures.
Customer feedback: An agent’s reputation with customers, based on feedback, and CSAT surveys.
Benefits of Using Contact Center Dashboards
Contact center dashboards are an essential resource in the current age of customer experience. They ensure companies are leveraging their resources effectively, delivering consistently excellent experiences, and providing the right training to staff. An effective set of contact center dashboards provides organizations with:
Enhanced visibility and transparency: Contact center dashboards provide companies with comprehensive and scannable insights into contact center KPIs. They give executives, supervisors, and even agents comprehensive visibility into the success of contact center operations, agent performance, and the wider customer journey.
Improved decision-making abilities: With real-time insights and historical data, contact center dashboards empower companies to make intelligent decisions to promote business growth. Dashboards ensure companies can rapidly adapt to changes in customer preferences and call volumes while optimizing resource allocation.
Increased productivity and efficiency: Agent dashboards, real-time dashboards, and more can help motivate and engage agents. They provide crucial insights into agent performance and help to drive them towards producing better results. What’s more, by carefully monitoring agent performance, supervisors can identify opportunities for targeted coaching, training, and contact center workflow adjustments.
Better customer satisfaction: Contact center dashboards give companies the behind-the-scenes view they need of the customer journey to improve experiences. They allow organizations to monitor customer feedback, analyze sentiment, and identify pain points, so they can build more effective strategies to drive customer loyalty.
Reduced costs: Insights into agent performance and workload distribution can help organizations enhance resource optimization. This helps to minimize operational costs, and ensures companies are using their assets as effectively as possible.
5 Best Practices for Implementing Contact Center Dashboards
While contact center dashboards can deliver countless benefits to businesses, their value depends on how well they’re implemented into your environment. To ensure you get the best results out of your dashboards, follow these best practices:
Prioritize Simplicity
Dashboards are intended to simplify and streamline access to data in your contact center. Over-stuffing dashboards with too much information at once can lead to confusion and complexity. Before you start introducing dashboards to your team, make sure you establish clear goals and objectives for each solution you’re going to build.
Consider creating different dashboards for different groups and employees, so you can focus on delivering the most valuable data to each staff member, without causing confusion. Additionally, make sure you leverage data visualization tools to simplify complex information. For instance, a report builder can allow you to convert statistics into charts or bar graphs, making it easier to visualize different data. When dashboards are user-friendly, agents and supervisors can quickly access the information they need, reducing the time spent searching for data.
Focus on the Right Metrics and KPIs
Today’s dashboard technology is extremely flexible, allowing companies to pinpoint and analyze a huge range of metrics and KPIs. However, not all of these data points will be relevant to your business. Choose metrics to monitor based on your specific business goals.
For instance, if your goal is to improve customer retention and satisfaction, you might concentrate on customer satisfaction scores, net promoter scores, and metrics that influence customer effort scores, such as average handling time or wait time.
Integrate Third Party Tools
Contact center dashboards deliver the best results when they integrate seamlessly with other resources in your organization. Your dashboards should be able to import and collect data from your Customer Relationship Management (CRM) software, ticketing software, and even your workforce engagement or management software. Integrating with a 3rd party tool helps consolidate information from multiple sources, making it easier to analyze trends.
Look for a solution that supports simple integrations with leading business tools, or work with a vendor that enables custom integrations through APIs.
Provide Adequate Training and Support
Extensive and customized training is crucial to ensuring your employees can derive the most value from your contact center dashboards. Your employees should know how to read the data they see on their dashboards, adjust their view to suit their needs, and troubleshoot common issues.
Provide onboarding training to new employees and ensure your staff members have access to documentation that will help them sidestep any issues.
Regularly Review and Update Your Dashboard
Over time, the metrics you need to monitor, and the ideal structure of your contact center dashboards may change. Based on your evolving business goals, and the feedback you receive from your employees, be prepared to regularly review, and update your dashboard configurations.
Make sure you can easily customize your dashboard to meet your changing needs, and even integrate the platform with new tools when necessary. Regularly updating your dashboard is not just a maintenance task; it’s a strategic initiative that drives continuous improvements within your contact center.
Discover the Power of Contact Center Dashboards
Contact center dashboards are a powerful way to track critical metrics and KPIs throughout your contact center. They can give you behind-the-scenes insights into employee performance, customer preferences, and opportunities for growth.
Request a demo with a ComputerTalk representative to learn how we can support your contact center goals and enhance your operational efficiency.
More from our blog
 The ice Contact Center already has full support for Microsoft Teams.
Using the Teams client in conjunction with iceBar not only gives agents advanced call controls, but also screen pop and application integrations, visibility into the state...
 Let’s talk about what’s happening inside a typical education contact center right now.
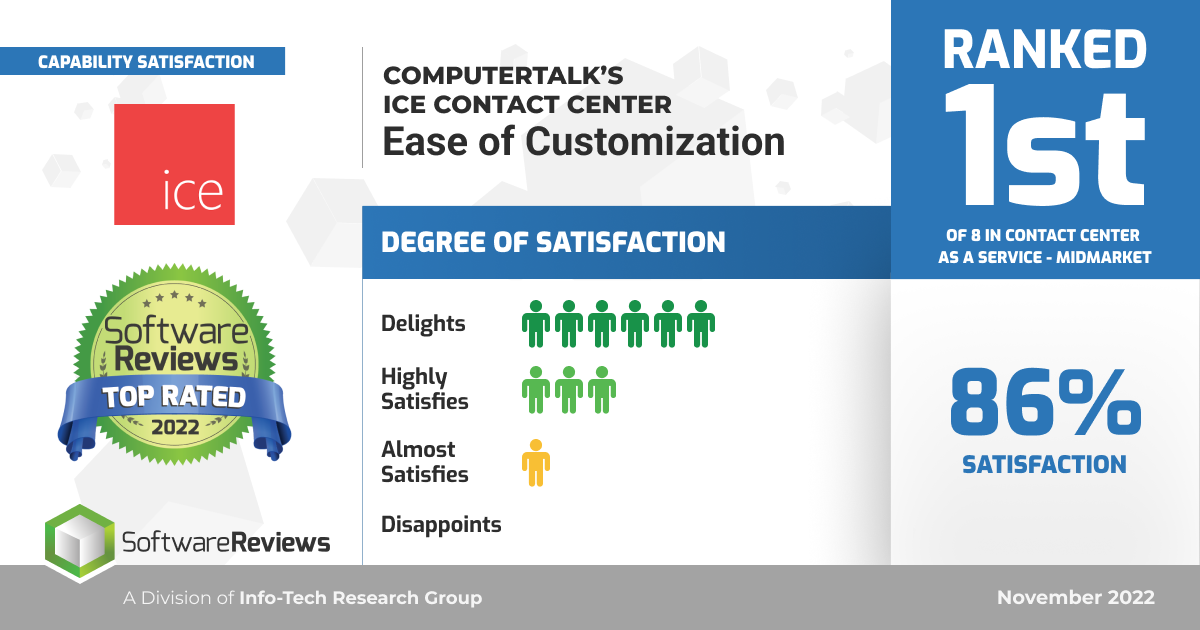
 ComputerTalk is pleased to announce that we have been scored as a leader against competitors in the Ease of Customization category in InfoTech Research Group’s Software Reviews.

